- Visibility 278 Views
- Downloads 75 Downloads
- Permissions
- DOI 10.18231/j.ijpca.2024.047
-
CrossMark

Quantitative estimation & validation of paracetamol and lornoxicam by using hydrotropy solubilization phenomena
Abstract
Drug analysis used organic solvents, which are more expensive, hazardous, and polluting the environment. In order to present a straightforward, accurate, innovative, safe, and precise approach for determining the amounts of Lornoxicam (LOX) and Paracetamol (PCM) in bulk and tablet Dosage forms, an appropriate substitute for using organic solvents would be a hydrotropic solution. In order to perform spectrophotometric analysis, Lornoxicam and Paracetamol, which are poorly soluble in water, were dissolved from the fine powder of their tablets using urea solution, a hydrotropic agent. The suggested techniques are the simultaneous equation method and absorbance ratio method and the. LOX and PCM have respective λmax of 384 and 244 nm. In 8M urea (a hydrotropic agent), the concentration ranges were 2-10μg/ml (r2=0.999) and 20-60μg/ml (r2=0.999), respectively. LOX and PCM both follow Beer's law. Precision, Accuracy, and additional statistical evaluation values were discovered to be in good agreement with the recommended values after the proposed procedures were validated in accordance with ICH criteria.
Introduction
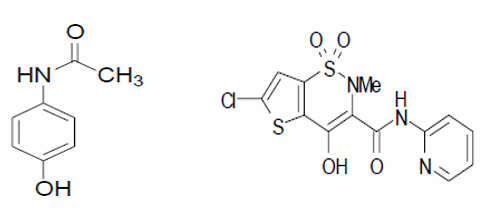
To improve the aqueous solubility of medications that are not very soluble in water, a variety of methods have been used. One such technique is hydrotropic solubilisation.[1] A class of chemical compounds known as hydrotropes increases the aqueous solubility of some solutes that are normally sparingly soluble in water by a factor of several. The important components of a drug's therapeutic efficacy are its bioavailability and, ultimately, its solubility to achieve the right concentration in the systemic circulation. Because of their limited water solubility and high permeability, dissolution from delivery methods is the rate-limiting step in their absorption and systemic bioavailability.[2], [3] Because of the ease of recovering the dissolved solute and the potential for reusing hydrotrope solutions, hydrotropy can be viewed as a promising and industrially appealing technology for increasing the water solubility of intractable and marginally soluble pharmaceuticals. To improve the aqueous solubility of medications that are not very soluble in water, hydrotropes like PEG 6000, sodium salicylate, sodium benzoate, sodium hydroxide, niacinamide, sodium citrate, urea and polyvinyl alcohol, have been used.[3] Chemically known as N-(4-hydroxyphenyl) acetamide, or PCM ([Figure 1] a), PCM has antipyretic and analgesic properties and is applied to alleviate pain such headaches, toothaches, rheumatism, and neuralgia.[4] The way that PCM works is by inhibiting the COX enzyme and prostaglandin synthesis in the CNS[5] and by directly affecting the hypothalamus, which regulates body temperature.[6] As a novel (NSAID) with notable analgesic characteristics, LOX is chemically known as 6-chloro-4-hydroxy-2-methyl- N-2-pyridyl-2H-thieno [2, 3-e]-1, 2-thiazine-3-carbox-amide-1, 1-dioxide) ([Figure 1] b).[7] The yellow crystalline material known as LOX has a partition coefficient of 1.8 and a pKa of 4.7 when measured in phosphate pH 7.4-octanol.Spectrophotometric methods[8], [9], HPLC [10], TLC[11], HPTLC [12], LC-MS [13], FTIR[14], amperometric analysis[15], fluorimetry [16], and micellar electrokinetic chromatographic method[17] have all been reported to estimate PCM alone or in combination with other medications. There aren't many analytical techniques for voltametric LOX determination.[18] UV spectrophotometric[19], polarographic.[20] There have been reports of LC/MS/MS[21], [22] and HPLC[23], [24], [25], [26] in pharmaceutical formulations and plasma. However, no techniques for spectrophotometric assessment of the dose form of paracetamol and lornoxicam tablets employing hydrotropic solubilising agents have been published.
Materials and Methods
Materials
A UV/visible spectrophotometer (Model-UV-1700, Shimadzu, Japan) was utilized to measure the spectrum. This has a 1 cm quartz matched cell and a double beam double detector arrangement. Wensar Ltd. sold the electronic balance, REMI Instruments Limited sold the cyclo mixer, and REMI Instruments Limited sold the centrifuge. Lupin Laboratories, located in Mumbai, India, generously provided an analytically pure sample of PCM and LOX. Mumbai-based Loba Chemie Pvt. Ltd. provided the urea. The pharmacological dosage forms used in this study were Neucam-P (Lupin (Maxter) Laboratories, Mumbai, India) and Lornicam Plus 8 (Aristo pharmacological Pvt. Ltd, Delhi, India) tablets, which included 500 mg PCM and 8 mg LOX. They were bought from the neighbourhood drugstore. In-house triple-distilled water was produced.
Method 1- Simultaneous estimation method
Determination of λmaxof drugs
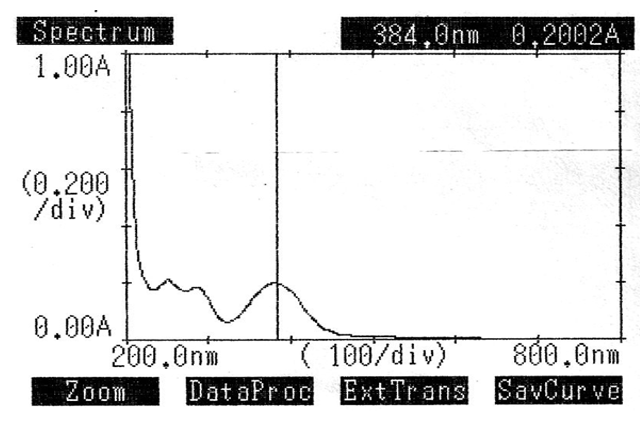
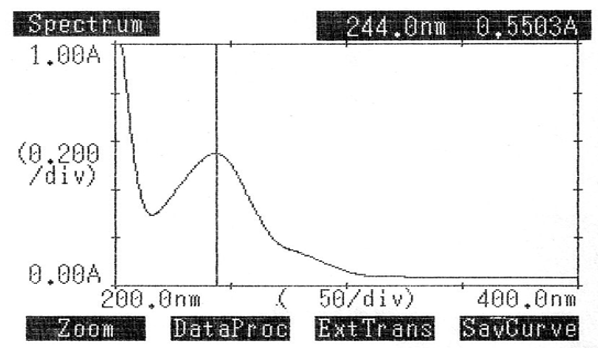
Pure LOX and PCM (10 mg/ml) were combined to create a standard solution. A UV spectrophotometer was used to scan the pure drug solutions, and the maximum absorbance for LOX and PCM was found to be 384.0 nm and 244.0 nm, respectively. Figures two and three display the UV spectra.
Standard stock solution
A carefully weighed powder sample containing 100 mg of PCM and LOX was added to a 100 ml volumetric flask separately along with 20ml of an 8M urea solution. The drug was dissolved in the flask by sonicating it for around 20 minutes in order to get a concentration of 1000μg/ml. After that, distilled water was used to regulate the volume. The mixture was filtered with Whatmann filter paper No. 41.
Working standard solution
One milliliter of the LOX standard stock solution was transferred to a 100 milliliter volumetric flask, and distilled water was used to adjust the volume. Absorbance was evaluated in a UV spectrophotometer following the generation of different amounts, ranging from 2 to 10μg/ml. One milliliter of the PCM standard stock solution was added to a 100 milliliter volumetric flask, and the volume was adjusted with distilled water. A UV spectrophotometer was used to evaluate absorbance at various doses (20 to 60μg/ml).
Preparation of the calibration curves of the drug
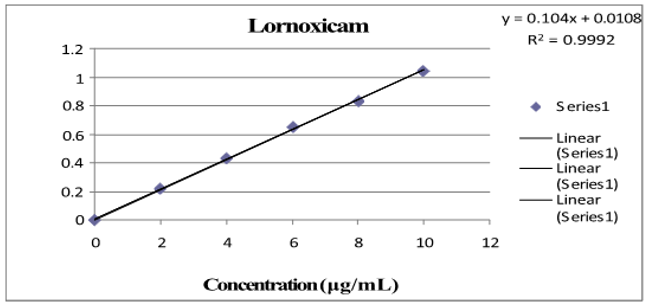
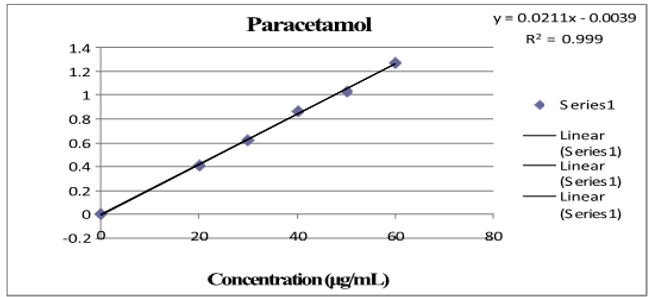
Three absorbance measurements of both reference drug solutions were made, and plotting the mean drug absorbance against the drug's concentration was done for PCM and LOX, respectively. The regression equation was found using this curve. [Table 1] shows the LOX and PCM optical parameter results.[Figure 4], [Figure 5] depict a typical calibration curve for PCM and LOX, respectively.
Preparation of analysis of tablet formulation
To create a fine powder, twenty tablets were precisely weighed and crushed. To solubilise the medication, 20 ml of 8M urea solution and 100 mg of carefully weighed paracetamol were added to a 100 ml volumetric flask. After that, the flask was shaken for around ten minutes. The volume was adjusted using distilled water, which was subsequently filtered. A 10-milliliter volumetric flask with 10 milliliters of filtrate was filled with five milliliters of solution, and the volume was corrected to 10 milliliters using distilled water. The volume was changed to achieve the desired final concentration. At 244.0 and 384.0 nanometers the absorbance was measured in relation to a blank.[Table 2] displays the findings of the tablet formulation investigation.
Validation
Linearity
Linearity is the ability of an analytical method to yield tests that are exactly proportionate to the analyte's absorbance in the sample (within a given range). The calibration curve was created after five different concentrations (range from 2 to 10 μg/ml and 20 to 60 μg/ml) were examined. Each concentration's absorbance was measured three times, and the mean absorbance for PCM and LOX was calculated, respectively.[Figure 4], [Figure 5] shows the regression equation and correlation coefficient of the drug's standard curve for PCM and LOX, respectively.
Accuracy
Recovery tests were carried out to verify the established approach's accuracy. To the pre-analyzed sample solution, a certain concentration of the standard drug (80%, 100%, and 120%) was added. After that, the recovery was analyzed, and[Table 3] shows the findings.
Precision
Repeatability
Standard dilutions were prepared and three replicates of each dilution were analyzed on the same day to guarantee repeatability. After then, the data were statistically assessed. Standard dilutions were prepared, and on different days, multiple analysts analyzed three duplicates of each dilution.[Table 4] presents the findings of a statistical analysis.
Intermediate precision
Analyst to analyst
The standard dilution was made, and for every developed procedure, three copies of each dilution were examined by several analysts. The findings, which show the intermediate precision with differences within laboratories (various days, different analyzers, different equipment, etc.), are shown in [Table 5].
Absorbance ratio method (Q-Analysis)
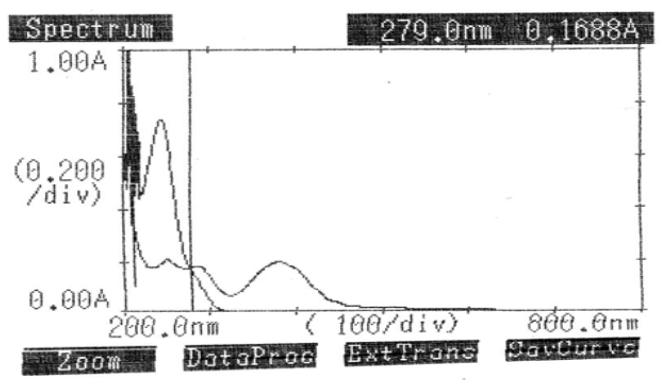
The Q-absorbance method uses the ratio of absorbance at two specified wavelengths, one of which represents the isoabsorptive point and the other the λmax of one of the two components. As outlined in method 1, the calibration curve and standard stock solution were created. Two wavelengths were chosen from the overlain spectra of LOX (10μg/ml) and PCM (20μg/ml) to construct the Q-absorbance depicted in [Figure 6]: the isoabsorptive point at 279.0 nm and the LOX λmax at 384.0 nm. The absorptivity coefficients of each medication at both wavelengths were ascertained, along with the absorbances of PCM at 279.0 nm (isoabsorptive point) and LOX at 384.0 nm (λmax).[Table 6] displays the findings of the tablet formulation investigation.
Validation
Linearity
After analysis, five different concentrations (range from 2 to 10μg/ml and 20 to 60μg/ml) were plotted on the calibration curve. For every concentration, absorbances were measured three times, and the mean absorbance for PCM and LOX was calculated, respectively.[Figure 4], [Figure 5] show the regression equation, correlation coefficient and standard curve for PCM and LOX, respectively.
Accuracy
To the pre-analyzed sample solution, a certain concentration of the standard drug (80%, 100%, and 120%) was added. After that, the recovery was analyzed, and [Table 7] shows the findings.
Precision
Repeatability
After then, the data were statistically assessed. Standard dilutions were prepared, and on different days, multiple analysts analyzed three duplicates of each dilution.[Table 8] presents the findings of a statistical analysis.
Analyst to analyst
Three replicates of the standard dilutions were prepared for each of the suggested processes, and the outcomes are shown in[Table 9].
|
S. No. |
Parameter |
Lox |
Pcm |
|
1. |
λmax |
384nm |
244 nm |
|
2. |
(µg/ml) |
2-10µg/ml |
20-60µg/ml |
|
3. |
Regression equation |
Y=0.104 conc.+0.0108 |
Y=0.0211conc.-0.0039 |
|
4. |
Correlation Coefficient(r2) |
0.999 |
0.999 |
|
BrandName |
PCM |
LOX |
||
|
LabelClaim(mg) |
%Purity |
Label Claim(mg) |
%Purity* |
|
|
Neucam-P |
500 |
99.5% |
8 |
98.8% |
|
Drug |
Amountpresent (μg/ml) |
Amountadded (μg/ml) |
Amountfound (μg/ml) |
% Recovery |
|
PCM |
25 |
20 |
19.8 |
99.0 |
|
25 |
25 |
25.1 |
100.4 |
|
|
25 |
30 |
29.9 |
99.6 |
|
|
LOX |
6 |
4.8 |
4.79 |
99.7 |
|
6 |
6 |
5.99 |
99.8 |
|
|
6 |
7.2 |
7.22 |
100.2 |
|
Drug |
Labelclaim mg/tab |
Amount found* mg/tab |
Labelclaim (%) |
S.D. |
% RSD |
|
PCM |
500 |
498.99 |
99.79 |
0.107 |
0.115 |
|
LOX |
8 |
7.98 |
99.75 |
0.115 |
0.115 |
|
Analyst |
Labelclaim mg/tab |
Amountfound* mg/tab |
Labelclaim (%) |
S. D. |
%RSD |
|||||
|
|
PCM |
LOX |
PCM |
LOX |
PCM |
LOX |
PCM |
LOX |
PCM |
LOX |
|
1 |
500 |
8 |
500.10 |
7.93 |
100.02 |
99.12 |
0.264 |
0.150 |
0.132 |
0.154 |
|
2 |
500 |
8 |
498.00 |
7.90 |
99.60 |
98.75 |
0.159 |
0.120 |
0.107 |
0.135 |
|
BrandName |
PCM |
LOX |
||
|
LabelClaim(mg) |
%Purity |
LabelClaim(mg) |
%Purity* |
|
|
Lornicam plus 8 |
500 |
99.80 |
8 |
98.70 |
|
Drug |
Amountpresent (μg/ml) |
Amountadded (μg/ml) |
Amountfound (μg/ml) |
%Recovery |
|
PCM |
25 |
20 |
20.1 |
100.50 |
|
25 |
25 |
25.3 |
101.20 |
|
|
25 |
30 |
30.0 |
100.00 |
|
|
LOX |
6 |
4.8 |
4.82 |
100.41 |
|
6 |
6 |
5.95 |
99.16 |
|
|
6 |
7.2 |
7.16 |
99.44 |
|
Drug |
Labelclaim mg/tab |
Amountfound* mg/tab |
Labelclaim (%) |
S.D. |
%RSD |
|
PCM |
500 |
498.50 |
99.70 |
0.712 |
0.714 |
|
LOX |
8 |
7.92 |
99.00 |
0.251 |
0.258 |
|
Analyst |
Labelclaim mg/tab |
Amount found*mg/tab |
Labelclaim (%) |
S.D. |
%RSD |
|||||
|
|
PCM |
LOX |
PCM |
LOX |
PCM |
LOX |
PCM |
LOX |
PCM |
LOX |
|
1 |
500 |
8 |
500.20 |
7.98 |
100.04 |
99.75 |
0.156 |
0.198 |
0.214 |
0.207 |
|
2 |
500 |
8 |
499.50 |
7.97 |
99.90 |
99.62 |
0.075 |
0.101 |
0.284 |
0.265 |
Conclusion
Because the 8M urea solution (as a hydrotropic agent) did not interfere, the simultaneous equation method and the absorbance ratio method were found to be simple, accurate, economical, and rapid for the measurement of PCM and LOX in bulk and dosing forms for tablets. The recommended method works well for routinely examining dose forms that contain LOX and PCM.
Source of Funding
None.
Conflict of Interest
None.
References
- Shete A, Yadav A, Dabke A, Sakhare S. Formulation and evaluation of hydrotropic solubilization based suspensions of Griseofulvin. Int J Pharma Sci Res. 2010;1(1):51-7. [Google Scholar]
- Vinnakota S, Deveswaran R, Bharath S, Basavaraj B. Application of mixed hydrotropic solubilization in spectrophotometric estimation of aceclofenac in tablets. J Curr Pharm Res. 2011;1(3):223-6. [Google Scholar]
- Gurumurthy V, Deveswaran R, Bharath S, Basavaraj B, Madhavan V. Application of hydrotropic solubilisation in simultaneous estimation of Atenolol and Amlodipine Besylate. Asian J Res Chem. 2012;5(1):57-60. [Google Scholar]
- Budavari S. . The Merck Index. . 1996. [Google Scholar]
- Amadio P. Peripherally acting analgesics. Am J Med. 1984;77(3A):17-26. [Google Scholar]
- Dollery C. . Therapeutic Drugs. 1999. [Google Scholar]
- Balfour J, Fitt A, Barradell L. A review of its pharmacology and therapeutic potential in the management of painful and inflammatory conditions. Drugs. 1996;51(4):639-57. [Google Scholar]
- Nogowska M, Muszalska I, Zajac M. Simultaneous spectrophotometric determination of acetyl salicylic acid, paracetamol and caffeine in pharmaceutical preparations. Anal Chem. 1999;44:1041-9. [Google Scholar]
- Dinc E, Yucesoy C, Onur F. Simultaneous spectrophotometric determination of mefenamic acid and paracetamol in pharmaceutical preparations using ratio spectra derivative spectrophotometry and chemometric methods. J Pharm Biomed Anal. 2002;28(6):1091-100. [Google Scholar]
- Zarapkar S, Hulkar U, Bhandari N. Reverse phase HPLC determination of ibuprofen, paracetamol and methocarbamol in tablets. Indian Drugs. 1999;36:710-3. [Google Scholar]
- Liang Y, Hu J, Wu H, Le L, Wang W. Determination of paracetamol and amantadine HCl tablets in pharmaceuticals by HPLC. TLC and CRM. Yaowu Fenxi Zazhi (Chinese). 2006;26:411-5. [Google Scholar]
- Argekar A, Sawant J. Simultaneous determination of paracetamol and mefenamic acid in tablets by HPTLC. J Planar Chromatogr-Mod TLC. 1999;12:361-5. [Google Scholar]
- Godejohann M, Tseng L, Braumann U, Fuchser J, Spraul M. Characterization of paracetamol metabolite using on-line LCSPE- NMR-MS and a Cryogenic NMR-Probe. J Chromatogr A. 2004;1058(1-2):191-7. [Google Scholar]
- Ekgasit S, Ayakkorn N, Tongsakul D, Thammancharoen C, Kongyou T. A novel ATR FTIR micro spectroscopy technique for surface contamination analysis without interference of substrate. Anal Sci. 2007;23(7):863-71. [Google Scholar]
- Prabakar S, Narayanan S. Amperometric determination of paracetamol by a surface modifi ed cobalt hexacyanoferrate graphite wax composite electrode. Talanta. 2007;72(5):1818-45. [Google Scholar]
- Llorent-Martínez E, Satinsky D, Solich P, Orega-Barrales P, Diaz A. Fluorimetric SIA optosensing in pharmaceutical analysis determination of paracetamol. J Pharm Biomed Anal. 2007;45(2):318-39. [Google Scholar]
- Emre D, Ozaltin N. Simultaneous determination of paracetamol, caff eine and propyphenazone in ternary mixtures by micellar electro kinetic capillary chromatography. J Chromatogr B. 2007;847(2):126-58. [Google Scholar]
- Ghoneim M, Beltagi A, Radi A. Square-wave adsorptive stripping voltammetric determination of the anti-inflammatory drug lornoxicam. Anal Sci. 2002;18(2):183-9. [Google Scholar]
- Nemutlu E, Demircan S, Kir S. Determination of lornoxicam in pharmaceutical preparations by zero and fi rst order derivative UV Spectrophotometric methods. Pharmazie. 2005;60(6):421-6. [Google Scholar]
- Ibrahim C, Nisa K, Sule A. Polarographic determination of lornoxicam in pharmaceutical formulations. CBU J Sci. 2009;5(1):11-9. [Google Scholar]
- Kim YH, Ji HY, Park ES, Chae SW, Lee HS. Liquid chromatography electrospray ionization tandem mass spectrometric determination of lornoxicam in human plasma. Arch Pharm Res. 2007;30:905-915. [Google Scholar]
- Zeng Y, Chen X, Zhang Y, Zhong D. Determination of lornoxicam in human plasma by LC/MS/MS. Yao Xue Xue Bao. 2004;39(2):132-7. [Google Scholar]
- Welte S, Rich D. Determination of the novel nonsteroidal anti-inflammatory drug lornoxicam and its main metabolite in plasma and synovial fluid. J Chromatogr B. 1998;707(1-2):151-60. [Google Scholar]
- Nakamura A, Nakashima M, Wada M, Nakashima K. Semi-micro column HPLC of three oxicam non-steroidal anti-Inflammatory drugs in human blood. Bunseki Kagaku. 2005;54(9):755-60. [Google Scholar]
- Taha E, Salama N. Abdel Fatt ah Lel-S. Stability-indicating chromatographic methods for the determination of some oxicams. J AOAC Int. 2004;87(2):366-73. [Google Scholar]
- Kiran R, Devanand S, Rane V, Sangshetti J. Stability-indicating LC method for analysis of lornoxicam in the dosage form. Chromatographia. 2009;69:1001-5. [Google Scholar]
- Abstract
- Introduction
- Materials and Methods
- Method 1- Simultaneous estimation method
- Determination of λmaxof drugs
- Standard stock solution
- Working standard solution
- Preparation of the calibration curves of the drug
- Preparation of analysis of tablet formulation
- Validation
- Precision
- Repeatability
- Intermediate precision
- Analyst to analyst
- Absorbance ratio method (Q-Analysis)
- Validation
- Precision
- Analyst to analyst
- Conclusion
- Source of Funding
- Conflict of Interest
- References