- Visibility 206 Views
- Downloads 32 Downloads
- Permissions
- DOI 10.18231/j.ijpca.2023.047
-
CrossMark

A Quality by Design (QBD) approach for the development and validation of RP-HPLC method for the quantification of linagliptin tablets
- Author Details:
-
 ABM Mahfuz ul Alam *
-
Iqbal Rouf Mamun
-
Nilufar Nahar
-
Mohammad Shoeb
Abstract
This study emphasizes the pivotal role of Quality by Design (QbD) in the development of pharmaceutical methods, with a particular focus on risk assessment to ensure consistent quality. The research showcases the creation of a precise and practical HPLC method for Linagliptin Tablets, developed using QbD principles. This optimized method, designed through a systematic Design of Experiment approach, provides a robust and cost-effective solution for pharmaceutical analysis, promoting the consistent quality required within predefined specifications. The method employs C18 column (150 mm x 4.6 mm, 5μM) and employs isocratic elution with a mobile phase composed of Acetonitrile: Sodium Acetate Buffer with a pH of 4.5 in a ratio of 25:75. The flow rate was optimized at 1.0 mL/min, and peak detection was achieved using a UV detector set at 294 nm. The injection volume was standardized at 10 µL, and the Column Oven Temperature was maintained at 25°C. Rigorous validation following ICH Q 2 (R1) and USP <1225> guidelines ensure the method's reliability, with assessments of parameters such as limit of detection (LOD), limit of quantification (LOQ), accuracy, precision, and robustness. The method's exceptional sensitivity, selectivity, efficiency, precision, accuracy, and cost-effectiveness make it an optimal choice for pharmaceutical analysis of Linagliptin Tablets.
This method is intended for further use in routine analysis for quality control in the pharmaceutical industry and has demonstrated the ability to distinguish marketed products, including comparability with the innovator product.
Introduction
Traditionally, the development of analytical methods involved a time-consuming process of adjusting one system parameter at a time, leading to numerous experimental runs and the subsequent need for further refinement. The pharmaceutical industry has grappled with challenges such as out-of-trend (OOT) and out-of-specification (OOS) results, revealing vulnerabilities in the existing system. Reports of quality control (QC)-related warning letters from regulatory agencies underscore the pressing need for a novel strategy. The adoption of Quality by Design (QbD) in the pharmaceutical sector, mandated by regulatory bodies like the EMA, US FDA, and other ICH countries, represents a proactive response to challenges in analytical methods and related systems. [1], [2]
This journal article centers on implementing QbD principles in the development and validation of analytical methods for Linagliptin, emphasizing precision and reliability. Through a systematic and risk-based approach, QbD aids in comprehending critical method attributes, identifying potential risks, and establishing a comprehensive control strategy. [3], [4] Integrating these principles into the analytical method lifecycle enables researchers to optimize performance, reduce variability, and ensure compliance with regulatory requirements.
TRADJENTA ®, approved by the US FDA in 2011, features Linagliptin as its active pharmaceutical ingredient. As a dipeptidyl peptidase-4 (DPP-4) inhibitor, [5] Linagliptin plays a crucial role in the landscape of antidiabetic agents, necessitating stringent analytical methodologies to ensure the quality and safety of pharmaceutical formulations.
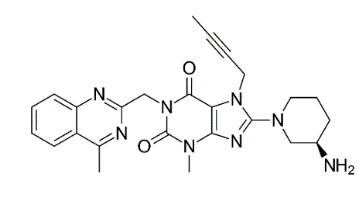
Linagliptin (C25H28N8O2) is chemically known as 8-[(3R)-3-aminopiperidin-1-yl]-7-(but-2-yn-1-yl)-3-methyl-1-[(4-methylquinazolin-2-yl)methyl]-3,7-dihydro-1H-purine-2,6-dione. The compound's distinctive properties, including polymorphism with two different forms and high solubility, pose both challenges and opportunities in the development and validation of analytical methods. This research explores a QbD-driven approach to address these challenges, highlighting the importance of regulatory compliance and the evolution of strategies in response to industry dynamics.
To address this need, a chromatographic separation method for Linagliptin was developed using Analytical Quality by Design (AQbD) principles. The method underwent optimization through a Design of Experiment (DOE) approach, considering critical factors such as buffer pH, acetonitrile concentration, flow rate, and oven temperature, while assessing responses like retention time, asymmetry, and theoretical plate. Statistical analyses, including counter plots, Pareto charts, and interaction plots, guided the development of an optimized method. [6], [7], [8]
The validated method adhered to ICH Q2 (R1) [4] and USP <1225> requirements, encompassing assessments of parameters like limit of detection (LOD), limit of quantification (LOQ), accuracy, precision, and robustness. It exhibited exceptional sensitivity, selectivity, speed, precision, accuracy, and cost-effectiveness, making it highly suitable for pharmaceutical industries in the analysis of Linagliptin Tablets.
Furthermore, the validated method was employed to quantify the active content in locally produced major drugs in various dosage forms and innovator's drugs. In-vitro dissolution comparisons using the f1 and f2 metrics demonstrated similarity across all examined brands, indicating comparable potency to the innovator's drugs. The majority of drugs manufactured in Bangladesh met international standards, affirming their efficacy for treating various health conditions, both locally and in overseas markets.
Experimental
Chemicals, reagents, and samples
Throughout pre-method development, method development, validation, and market product assessments, both analytical and gradient HPLC grade reagents and chemicals were employed. The reagents, including Acetonitrile, Sodium Acetate Trihydrate (NaC2H3O2·3H2O), Phosphoric Acid, Sodium Hydroxide, Hydrogen Peroxide, Sodium Metabisulfite, Sodium Acetate Trihydrate, and Glacial Acetic Acid, were obtained from Scharlau, Spain. Additionally, Phosphoric Acid and Acetonitrile were sourced from Merck, Germany. The reference standards for Linagliptin were supplied by Ruyuan HEC Pharm, China. Innovator product TRAJENTA, manufactured by Boehringer Ingelheim Roxane Inc, was acquired through Pharmaceutical Buyers Inc., USA.
Equipment
The experiments utilized USP Type A volumetric glassware crafted from borosilicate 3.3 glass beds, certified by Pyrex, USA, and Normax, Portugal. Glassware cleaning involved both manual and automatic methods using Labconco, USA equipment. Dissolution tests were conducted using an Eight Station Dissolution Apparatus (Hanson Research, USA) equipped with USP Apparatus I and II. Different experiments employed low-pressure gradient HPLC systems from Waters Corporation, Agilent Technologies, and Dionex Corporation. Additional instruments included ultra-micro, micro, and analytical balances (manufactured by Sartorius, Germany), a pH meter from Mettler, Switzerland, and thermal ovens & ultrasonic water baths from Memmert, Germany. HPLC columns were sourced from Prontosil (Bischoff Chromatography, Germany) and YMC (YMC Co. Ltd, Japan).
HPLC method development through AQbD framework
In the development of an HPLC method for Linagliptin using the Analytical Quality by Design (AQbD) approach, the following eight sequential steps were undertaken.[9], [10], [11]
The HPLC method development utilizing the Analytical Quality by Design (AQbD) approach followed a systematic eight-step process. In the initial step, the analytical method's target profile was qualitatively determined using a Fish Bone Diagram, considering various parameters such as the mobile phase, column, pH of the buffer, injection volume, and more. The literature search in the second step involved collecting data on the intended analyte's molecular structure, weight, pKa, functional group, Chromophore presence, partition coefficient, solubility, and available methods.
The third step focused on identifying method parameters through method scouting, considering the physiochemical properties of the analyte, mobile phase, and the compatibility of the stationary phase. In the fourth step, predictive critical method parameters were identified both qualitatively and quantitatively, distinguishing between predictable and unpredictable elements. The fifth step involved the application of Design of Experiments (DoE) for a multivariate interaction study, setting up critical method parameters across a range.
Screening and optimization in the sixth step provided a scientific understanding of the relationship between input variables and output responses, leading to the definition of an operable design space. The seventh step defined the final operable method, incorporating stability-indicating studies and executing method validation, assessing accuracy, precision, robustness, and solution stability.[12], [13]
The last step, monitoring and lifecycle management, involved the evaluation of market products and the reference listed drug (RLD), along with assessing change requirements for improvements. The entire process ensured a comprehensive and systematic approach to HPLC method development, emphasizing quality by design principles.
Evaluating Experimental Results and Identifying Optimal Method Parameters
The main goal was to explore the effects and interrelationships of four distinct factors: pH of the buffer solution, flow rate, percentage of acetonitrile, and column temperature, on multiple responses, specifically, retention time, peak asymmetry, and theoretical plate. To accomplish this, an experimental design was formulated to encompass the spectrum of each variable, as outlined in [Table 1].
|
S.N. |
Molecules Factors |
pH of Buffer |
% Acetonitrile |
Oven Temperature 0C |
Flow Rate (mL/min) |
Response |
|||
|
Min |
Max |
Min |
Max |
Min |
Max |
Min |
Max |
Retention Time, Asymmetry, Theoretical Plate |
|
|
1 |
Linagliptin |
4.0 |
5.0 |
20 |
60 |
25 |
45 |
0.8 |
1.5 |
Evaluating the true impact of all four variables on the three target responses would typically necessitate a considerable number of studies. To streamline this process and accelerate the identification of interaction patterns in a scientifically rigorous manner, a design of experiments (DoE) was developed using Microsoft Minitab Software 16.1.1. The DoE adopted a comprehensive full factorial experimental design, incorporating two (02) center points within each block.[13], [14]
This Design of Experiment (DoE) led to the identification of 18 unique experimental combinations, detailed in [Table 2]. Subsequently, these combinations were utilized to create various mobile phases by employing different permutations of buffer and organic solvent.
|
S.N. |
Method Parameters |
|||
|
pH |
% ACN |
Flow Rate |
Column Temp |
|
|
1 |
4 |
20 |
0.8 |
45 |
|
2 |
4.5 |
40 |
1.15 |
35 |
|
3 |
5 |
60 |
1.5 |
25 |
|
4 |
5 |
60 |
1.5 |
45 |
|
5 |
4 |
20 |
0.8 |
25 |
|
6 |
4 |
60 |
1.5 |
25 |
|
7 |
4 |
20 |
1.5 |
25 |
|
8 |
5 |
20 |
0.8 |
45 |
|
9 |
4 |
60 |
0.8 |
25 |
|
10 |
5 |
20 |
1.5 |
25 |
|
11 |
5 |
20 |
0.8 |
25 |
|
12 |
4 |
60 |
0.8 |
45 |
|
13 |
5 |
60 |
0.8 |
45 |
|
14 |
5 |
20 |
1.5 |
45 |
|
15 |
4 |
60 |
1.5 |
45 |
|
16 |
4 |
20 |
1.5 |
45 |
|
17 |
4.5 |
40 |
1.15 |
35 |
|
18 |
5 |
60 |
0.8 |
25 |
The objective was to optimize the HPLC method for Linagliptin analysis by conducting a comprehensive study of these parameters. This involved using a C18, 150 mm x 4.6 mm, 5 µM HPLC column with a 10 µL injection volume. The HPLC system was equipped with a PDA detector, operated at 294 nm, and included a column oven and auto-injector.[15], [16]
Assessment of Experimental Outcomes and Determination of Optimal Method Conditions
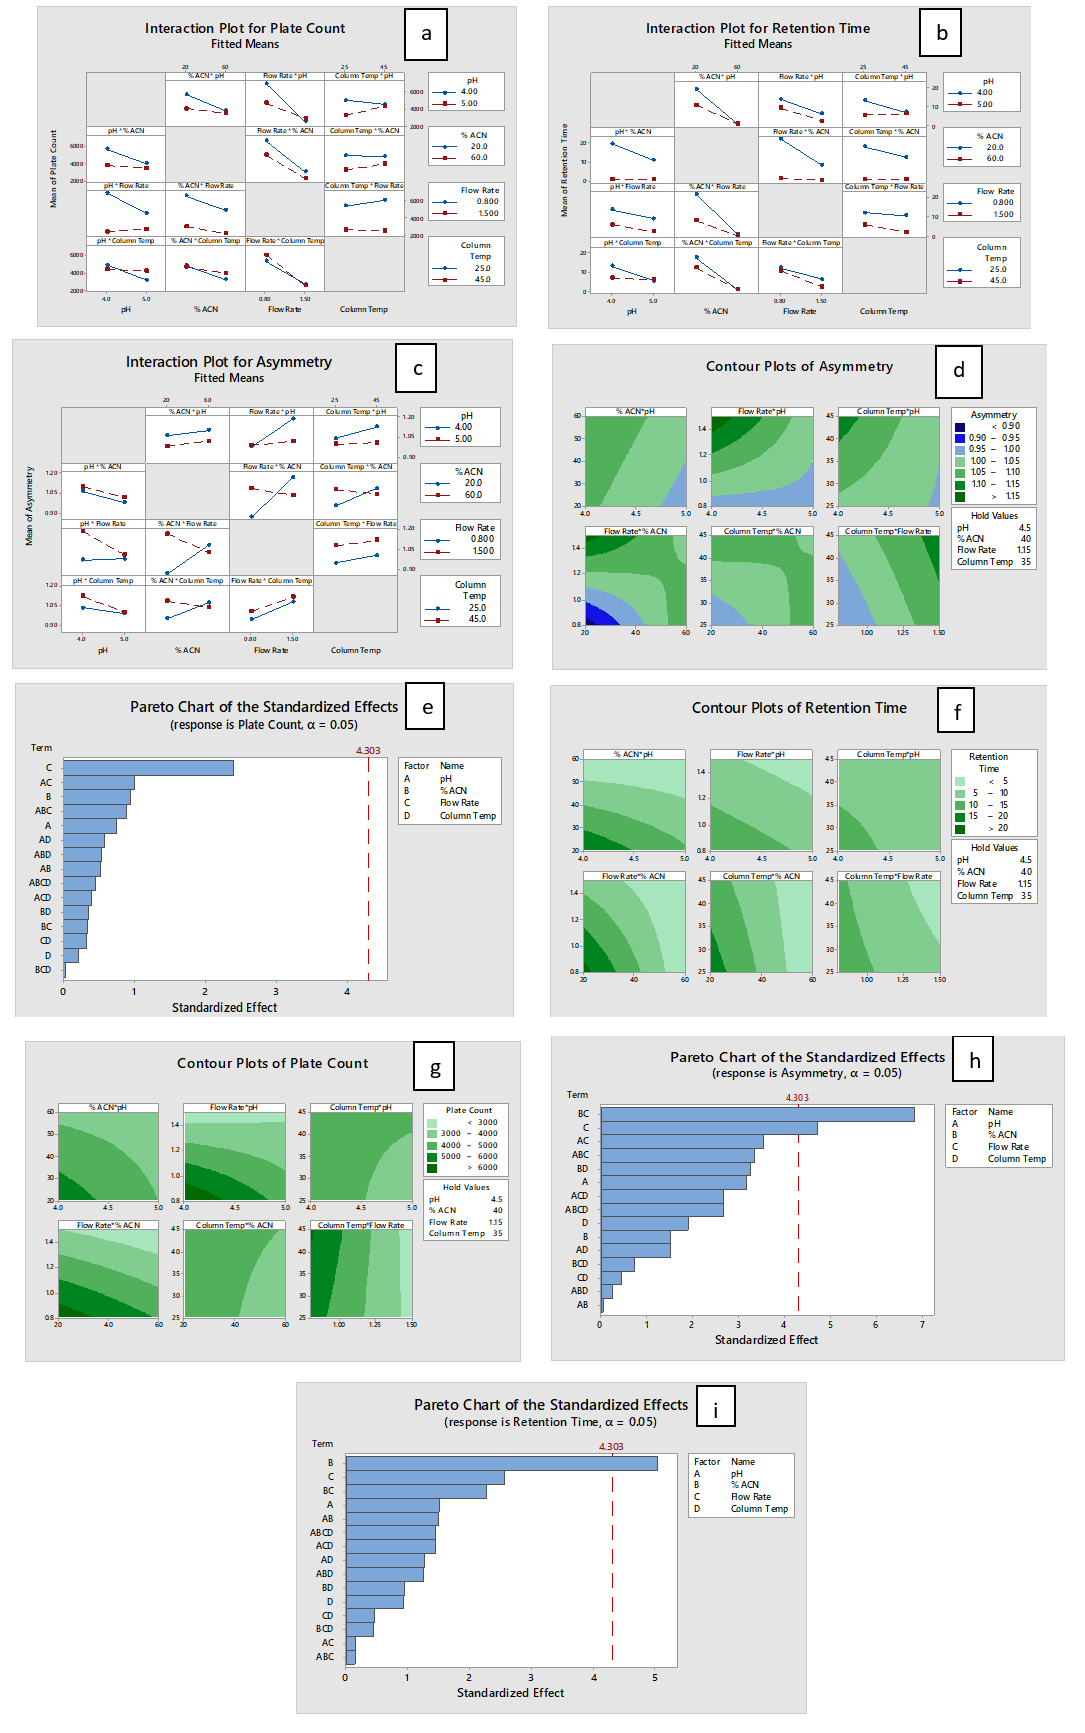
The responses to variations ([Table 3]) in individual factors were meticulously examined using various statistical models such as Interaction plots, Pareto charts, and Contour plots ([Figure 2] a-2i). These analyses were instrumental in obtaining a thorough understanding of the true impact of the four variables on the responses.
|
S.N. |
Method Parameters |
Response |
|||||
|
pH |
% ACN |
Flow Rate |
Column Temp |
Retention Time |
Asymmetry |
Plate Count |
|
|
1 |
4 |
20 |
0.8 |
45 |
26.23 |
0.83 |
8427 |
|
2 |
4.5 |
40 |
1.15 |
35 |
3.53 |
1.05 |
7706 |
|
3 |
5 |
60 |
1.5 |
25 |
0.95 |
1.04 |
1837 |
|
4 |
5 |
60 |
1.5 |
45 |
0.97 |
0.93 |
2167 |
|
5 |
4 |
20 |
0.8 |
25 |
27.91 |
0.81 |
8513 |
|
6 |
4 |
60 |
1.5 |
25 |
0.96 |
1.08 |
1994 |
|
7 |
4 |
20 |
1.5 |
25 |
24.21 |
1.14 |
4067 |
|
8 |
5 |
20 |
0.8 |
45 |
15.83 |
1.03 |
4715 |
|
9 |
4 |
60 |
0.8 |
25 |
1.86 |
1.1 |
4508 |
|
10 |
5 |
20 |
1.5 |
25 |
1.27 |
1.05 |
2308 |
|
11 |
5 |
20 |
0.8 |
25 |
19.68 |
0.8 |
4062 |
|
12 |
4 |
60 |
0.8 |
45 |
1.84 |
1.14 |
5480 |
|
13 |
5 |
60 |
0.8 |
45 |
1.83 |
1.02 |
5165 |
|
14 |
5 |
20 |
1.5 |
45 |
8.63 |
1.02 |
4240 |
|
15 |
4 |
60 |
1.5 |
45 |
0.99 |
1.06 |
2342 |
|
16 |
4 |
20 |
1.5 |
45 |
0.98 |
1.45 |
896 |
|
17 |
4.5 |
40 |
1.15 |
35 |
1.68 |
1.11 |
3304 |
|
18 |
5 |
60 |
0.8 |
25 |
1.75 |
1.07 |
3919 |
In summary, interaction plots were utilized to identify the type of interactions between variable factors and responses in the analysis of Linagliptin. Theoretical plates for Linagliptin demonstrated an inverse relationship with the concentration of acetonitrile and flow rate of the mobile phase, irrespective of buffer pH, while column temperature had an insignificant effect. Asymmetry showed a direct proportionality to the concentration of acetonitrile, column temperature, and flow rate. Retention time exhibited an inverse relationship with acetonitrile concentration, flow rate, and column temperature. The Design of Experiments (DoE) outcomes, presented in counter plots, illustrated response surfaces for theoretical plate, asymmetry, and retention time concerning different variables.
Theoretical plates were lower when acetonitrile concentration and flow rate were low but higher at high column temperature. Retention time was lower at high acetonitrile concentration, high flow rate, and high column temperature. Among the various factors, flow rate significantly impacted theoretical plates, acetonitrile concentration had a major effect on retention time, and both acetonitrile concentration and flow rate significantly influenced the asymmetry of Linagliptin. Considering these effects on responses, a response optimization was conducted using Minitab Software, identifying standardized values to achieve the highest composite desirability.
In consideration of these factors, the final Chromatographic Method for Linagliptin was formulated for subsequent Method Validation. The method employed Gradient High-Performance Liquid Chromatography (HPLC) systems from various manufacturers, including Agilent, USA, Dionex, USA, and Waters, USA. These systems were equipped with PDA detectors, a Column Oven, and an Auto Injector. The optimized HPLC column utilized was a C18, with dimensions of 150 mm x 4.6 mm and a particle size of 5µM. The mobile phase, tailored for optimal performance, comprised Acetonitrile: Sodium Acetate Buffer with a pH of 4.5 in a ratio of 25:75. The flow rate was optimized at 1.0 mL/min, and peak detection was achieved using a UV detector set at 294 nm. The injection volume was standardized at 10 µL, and the Column Oven Temperature was maintained at 25°C.
Method Validation
System suitability
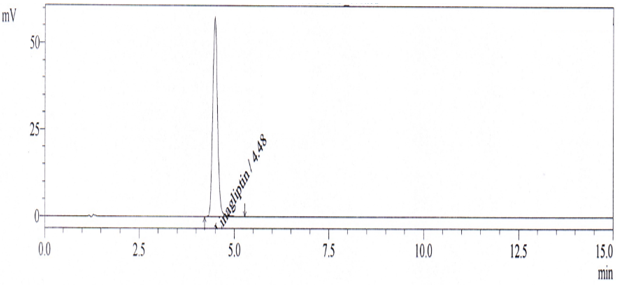
A comprehensive system suitability test was conducted using a representative chromatogram ([Figure 3]) to validate various parameters. Theoretical plates were determined to be 6824, peak asymmetry measured at 1.2, and the % RSD (Relative Standard Deviation) for six replicate injections for both area and retention time were found to be 0.1% and 0.82%, respectively.
Specificity
To confirm specificity, an analysis of placebo and formulated tablets was performed under both unstressed and stressed conditions to ensure the absence of interference from anticipated components. Notably, the placebo exhibited no interference with the analyte peak. Stressed samples were introduced into the HPLC system equipped with a Photodiode Array Detector. The sample demonstrated stability, except in the presence of peroxide ([Table 4]). Peak purity, measured at 997, indicated no interference from degradants, establishing the method as stability indicating.
|
Test Condition |
Placebo Interface at Main Peak |
Peak Purity by PDA |
Control Sample (%) |
Water Hydrolysis (40°C/2 Hours) (%) |
Thermal Stress (80°C/48 Hours) (%) |
Acid Stress (1.0 N HCl/40°C/2 Hours) (%) |
Base Stress (1.0 N NaOH/40°C/2 Hours) (%) |
Peroxide Stress (3% H2O2/40°C/2 Hours) (%) |
|
Linagliptin |
No |
998 |
99.8 |
99.3 |
98.7 |
98.9 |
55.2 |
25.3 |
Linearity
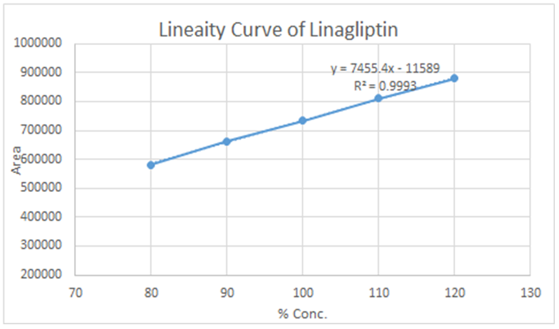
The calibration curve for Linagliptin exhibited linearity in the concentration range of 0.08 to 0.12 mg/ml. Five standard solutions of the analyte at concentrations of 80%, 90%, 100%, 110%, and 120% were prepared and analyzed to assess the response for the linearity study, as detailed in [Table 5]. The correlation coefficient, calculated from the peak area plotted against concentration ([Figure 4]), was determined to be 0.9993.
|
Level |
80% |
90% |
100% |
110% |
120% |
Correlation Coefficient |
|
Linagliptin |
581455 |
663072 |
733940 |
811034 |
880243 |
0.9993 |
Precision
The % RSD for repeatability in the measurement of Linagliptin at concentrations ranging from 80% to 120% (0.08-0.12 mg/mL) over six replicates was established to be below 0.44%. Interday precision demonstrated a mean recovery of 99.62%, with an % RSD of 1.2%. These results confirm the precision of the developed method.
Accuracy
To assess accuracy, a recovery study was undertaken by preparing sample solutions spiked at three levels: 80%, 100%, and 120% of 0.1 mg/mL nominal concentration. The % recovery data, obtained using the proposed HPLC method, is detailed in [Table 6]. The % recovery within the 98.6–101.5% range with % RSD of 1.61 and mean recovery 100.46 validates the accuracy of the developed method, aligning with the ICH Q2 (R1) guidelines.
|
Level |
80% |
100% |
120% |
Mean |
% RSD |
|
Linagliptin |
101.51 |
101.28 |
98.6 |
100.46 |
1.61 |
Robustness and Ruggedness Studies
The influence of variations in the mobile phase ratio (Buffer: Organic Phase), detector wavelength, pH of the buffer/aqueous phase, mobile phase flow rate, and column temperature on the retention time, peak area, and asymmetry of the primary analyte was explored using sample concentrations of 0.1 mg/mL. Noteworthy is the absence of significant alterations in responses despite variations in these method factors, attesting to the robustness of the methods, as indicated by an RSD of 0.2%.
|
Parameter |
Linagliptin |
|
|
RT |
Peak Area |
|
|
Flow Rate |
3.3 |
732400 |
|
3.5 |
735390 |
|
|
Elution Solvent ratios |
3.4 |
732985 |
|
3.5 |
736928 |
|
|
Detector Wavelength |
3.2 |
732839 |
|
3.3 |
732891 |
|
|
Temperature |
3.3 |
732590 |
|
3.3 |
733008 |
|
|
pH |
3.2 |
732803 |
|
3.4 |
733009 |
Limit of Detection (LOD) and Limit of Quantification (LOQ) for Linagliptin, determined through the Dionex HPLC Chromeleon Software, were identified as 1.17 ppm and 3.61 ppm, respectively.
Solution and Mobile Phase Stability
Both test and standard solutions were allowed to stand at room temperature for 2 days. Upon comparison with a freshly prepared standard solution after 24 hours, the result showed a deviation of 0.17%, increasing to 0.01% after 48 hours. These findings suggest that the stability of the sample solution remains largely unchanged for up to 48 hours.
Filter study
Samples and standard solutions were prepared and subjected to filtration using a variety of filters, including PTFE 0.45 micron, 0.22 micron, and Nylon 0.45 micron filters. The resultant filtered solutions were analyzed using the established chromatographic methods. The obtained results were scrutinized for variations in area associated with different filters. The % RSD of the difference in area was determined to be 1.1%, signifying negligible variation in results. Consequently, the method is considered suitable for both qualitative and quantitative analyses with all these filters.
|
Type of Filter |
PTFE 0.45 |
PTFE 0.22 |
Nylon 0.45 |
% RSD |
|
Linagliptin |
221875 |
226461 |
225673 |
1.1 |
Assay content of marketed products
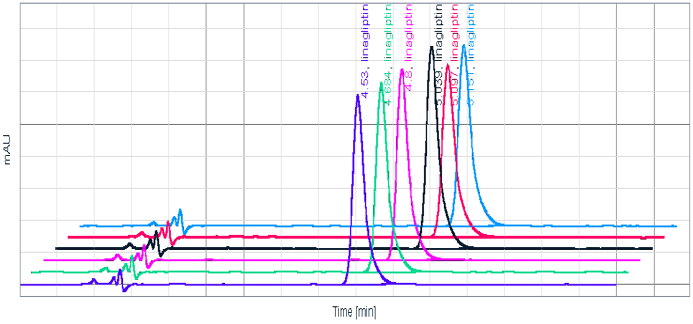
The established methods were effectively utilized to assess the identification and assay values of various prominent brands available in the Bangladesh market. The chromatographic separations were notably clear, ensuring no interference from the excipients. The products from all manufacturers tested complies within the target acceptance range (95.1% to 102.1%), as detailed in [Table 9].
|
Name of Molecule |
% Assay Value |
|
|||||
|
Innovator |
Mfg1 |
Mfg2 |
Mfg3 |
Mfg4 |
Mfg5 |
Remarks |
|
|
Linagliptin |
100.3 |
95.1 |
102.1 |
99.2 |
99.8 |
96.6 |
Results of two brands are out of trend |
Dissolution and In-Vitro Dissolution Comparison
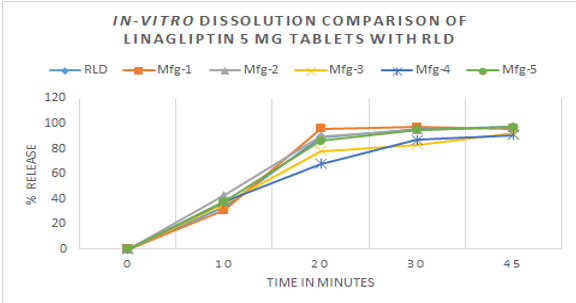
The dissolution evaluation of Linagliptin Tablets from five leading brands in Bangladesh was carried out using USP Apparatus II (Paddle) at 50 rotations per minute with 0.1 N HCl at 37°C. Employing the developed method, the analysis demonstrated favorable dissolution outcomes for most brands ([Table 10]). In vitro dissolution tests were conducted, comparing them with the Reference Listed Drug (RLD) at time points 10 mins, 20 mins, 30 mins, and 45 mins. The results, assessed through f1 (2.53 – 12.66) and f2 (46.0-78.1) values, suggesting that the major tested brands can be considered as bioequivalent to the branded products.
|
Sample |
RLD |
Mfg 1 |
Mfg-2 |
Mfg-3 |
Mfg-4 |
Mfg-5 |
Remarks |
|
Linagliptin |
97(97-98) |
96 (81-105) |
97(93-100) |
92(88-100) |
91(84-94) |
97(96-99) |
All brands have good and comparable results with RLD |
|
Name of Product |
f1/f2 |
Mfg-1 |
Mfg-2 |
Mfg-3 |
Mfg-4 |
Mfg-5 |
|
Linagliptin 5 mg Tablets |
f1 |
3.48 |
3.48 |
9.81 |
12.66 |
2.53 |
|
f2 |
70.07 |
66.56 |
52.32 |
46 |
78.12 |
Discussion
A quality-by-design High-Performance Liquid Chromatography (HPLC) method has been meticulously developed for the precise estimation of Linagliptin in pharmaceutical formulations. Employing a risk assessment strategy, the analytical target product profile identified crucial parameters such as retention time, theoretical plates, and peak asymmetry specific to Linagliptin analysis by HPLC. Critical quality attributes influencing the target product profile were discerned as mobile phase composition, pH of the buffer solution, flow rate, and oven temperature.
Utilizing a full factorial design with Minitab Software 16.1.1, incorporating four factors and three responses with two center points per block, a total of 18 independent runs were conducted. Variability in column selection, instrument configuration, and injection volume was meticulously controlled. The quality-by-design methodology effectively developed the HPLC method for Linagliptin, employing the following parameters: a C18 column with dimensions of 150 mm x 4.6 mm and a particle size of 5µM. The optimized mobile phase consisted of Acetonitrile: Sodium Acetate Buffer with a pH of 4.5 in a ratio of 25:75. The flow rate was set at 1.0 mL/min, with peak detection using a UV detector set at 294 nm. The injection volume was maintained at 10 µL, and the Column Oven Temperature was controlled at 25°C.
The validation of the method yielded satisfactory outcomes for system suitability, accuracy, precision, robustness, linearity, sample stability, filter effect, LOD, and LOQ. The method was effectively applied to assess major generic brands of Linagliptin Tablets in the Bangladesh market, demonstrating comparability to the innovator product by in-vitro dissolution test.
Conclusion
Analytical Quality by Design (QbD) principles were systematically implemented in the development of an HPLC method for Linagliptin. A comprehensive multivariate study, involving critical process parameters—specifically, the combination of mobile phase composition, buffer pH, flow rate, and oven temperature at various levels—was meticulously conducted to identify the optimal system and establish the final design space. This explorative process, facilitated by Design of Experiment Software in Minitab 16.1.1, enhanced the understanding of factors influencing chromatographic separation, ensuring that the methods effectively meet their intended purposes and paving the way for the development of chromatographic optimization for future applications.
All validated parameters consistently met acceptable criteria. The validated method for Linagliptin determination demonstrated characteristics of linearity, precision, accuracy, specificity, robustness, and ruggedness. The QbD methodology provided an in-depth comprehension of method variables, minimizing the risk of failure during method validation and transfer. The automated QbD method development approach, employing Minitab software, not only expedited the process but also resulted in a more robust method compared to manual development. Statistical analysis underscored the method's reproducibility, selectivity, accuracy, and robustness. This method is poised for further implementation in routine analysis for quality control within the pharmaceutical industry, demonstrating its capacity to distinguish marketed products, including comparability with the innovator product.
Source of Funding
None.
Conflict of Interest
None.
References
- . Guidance for Industry. Analytical Procedures and Methods Validation for Drugs and Biologics. . 2015. [Google Scholar]
- . International Council for Harmonisation of Technical Requirements for Pharmaceuticals for Human Use (ICH). ICH Harmonised Guideline. Pharmaceutical Development Q8(R2). . 2009. [Google Scholar]
- Raman N, Mallu U, Bapatu H. Analytical Quality by Design Approach to Test Method Development and Validation in Drug Substance Manufacturing. J Chem. 2015;2015. [Google Scholar] [Crossref]
- . International Council for Harmonisation of Technical Requirements for Pharmaceuticals for Human Use (ICH). . 2005. [Google Scholar]
- . . Linagliptin: FDA Approved Drug Products. U.S. Food and Drug Administration. . [Google Scholar]
- Alam AMu, Shilpi S, Mamun M. Method Development and Validation For Elemental Impurities Analysis Of Magnesium Stearate USP By ICP-OES. Eur J Pharm Med Res. 2020;7(11):153-60. [Google Scholar]
- Alam AMU, Nahar N, Husain M, Shilpi S. Constituents of The Essential Oil from Aquilaria Agallocha Roxb By Gc-Ms and Its Cytotoxic Activities. Eur J Pharma Med Res. 2020;7(12):105-9. [Google Scholar]
- Alam AMu, Naha N, Mamun MIR, Shoeb M. A QBD based RP-HPLC Method Development and Validation for Quantification of Pregabalin Capsules . Int J Sci Res. 2023;12(11):948-55. [Google Scholar]
- . United States Pharmacopoeia, USP <1225>, Validation of Compendial Methods. . . [Google Scholar]
- . US FDA Guidance for Industry, Dissolution Testing of Immediate Release Solid Oral Dosage Forms. . 1997. [Google Scholar]
- Alam AMu, Nahar N, Husain M, Shilpi S, Mosihuzzaman M. Constituents of the essential oil of Aquilaria agalocha Roxb, poster presented & abstracts published in Workshop on Medicinal plants, spices and Other Natural Products (ASOMPS X). Eur J Pharm Med Res. 2000;7(12):105-9. [Google Scholar]
- Chandrasekhar B. A new UV-method for determination of Linagliptin in bulk and pharmaceutical dosage form. Int J Biomed Sci. 2012;8(3):209-23. [Google Scholar]
- Reddy BS. A validated stability -indicating HPLC assay method for Linagliptin.. Der Pharmacia Sinica. 2014;5(5):123-30. [Google Scholar]
- Badugu L. A validated RP-HPLC method for determination of Linagliptin. Am J Pharm Tech Res. 2012;2(4):463-70. [Google Scholar]
- Ramzia I, El-Bagary E, Elkady B. Spectrophotometric Methods for the Determination of Linagliptin in Binary Mixture with Metformin Hydrochloride and Simultaneous Determination of Linagliptin and Metformin Hydrochloride using High Performance Liquid Chromatography. Int J Biomed Sci. 2013;9(1):41-7. [Google Scholar]
- Lakshmi B, Reddy T. A novel RP - HPLC method for the quantification of linagliptin in formulations. J Atoms Mol. 2012;2(2):155-64. [Google Scholar]
- Abstract
- Introduction
- Experimental
- Evaluating Experimental Results and Identifying Optimal Method Parameters
- Assessment of Experimental Outcomes and Determination of Optimal Method Conditions
- Method Validation
- Robustness and Ruggedness Studies
- Solution and Mobile Phase Stability
- Dissolution and In-Vitro Dissolution Comparison
- Discussion
- Conclusion
- Source of Funding
- Conflict of Interest
- References